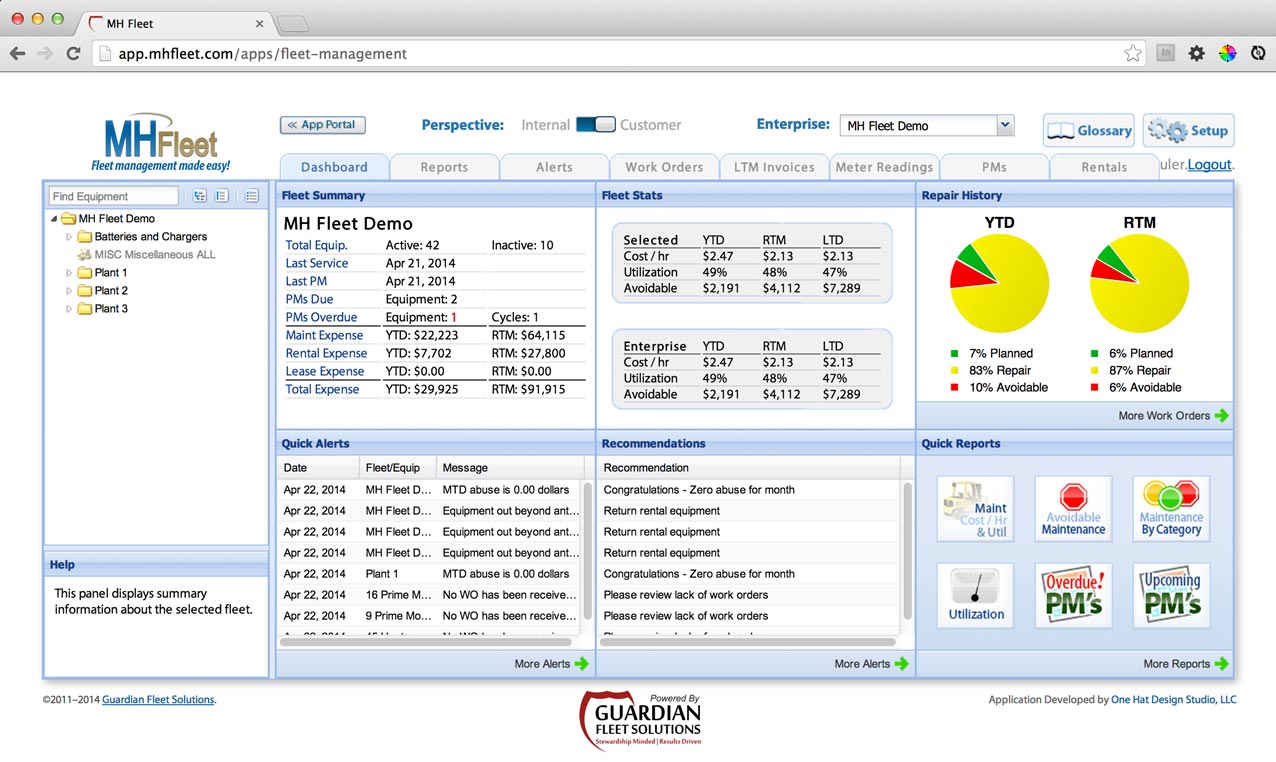
This screen presents the user with a broad overview of the entire enterprise at a glance. It provides quick access to the most important information. This screen is split into several panels, as described below.

Equipment Tree
This panel allows the user to select fleets, subfleets, or individual pieces of equipment for viewing or editing. When a node is selected, the panels on the right update to reflect information about the selected node. This type of interaction is found on all the main screens.
Help Panel
A help panel offers helpful hints according to what the mouse hovers over. This style of help panel is found on every screen.
Fleet / Equipment Summary
This panel displays summary information about the selected fleet or equipment. Its purpose is to answer the question, “Did I select the right node?” For equipment nodes, this panel displays a list of files that may be downloaded, a picture, and brief stats about the selected equipment.
Quick Alerts
Shows the most recent alerts for whichever fleet or equipment is currently selected, sorted by severity. Clicking the “More Alerts” button switches the screen to the Alerts Manager.
Stats
Shows cost per hour, utilization, and avoidable expenses stats for the selected node, as well as for the whole enterprise. Each of these stats is shown on a MTD, RTM, and LTD basis.
Recommendations
This panel shows actionable recommendations for the selected node, based on the top alerts shown to the left.
Repair History
Displays a chart of the YTD and RTM ratios between preventive maintenance, repairs, and avoidable expenses. Clicking the “More Work Orders” button changes to the Work Orders Manager.
Quick Reports
This panel has six clickable buttons. Each button represents a preset report (meaning its options cannot be changed from this screen). Clicking a button downloads the report for the selected node. Clicking the “More Reports” button changes to the Reports Manager.