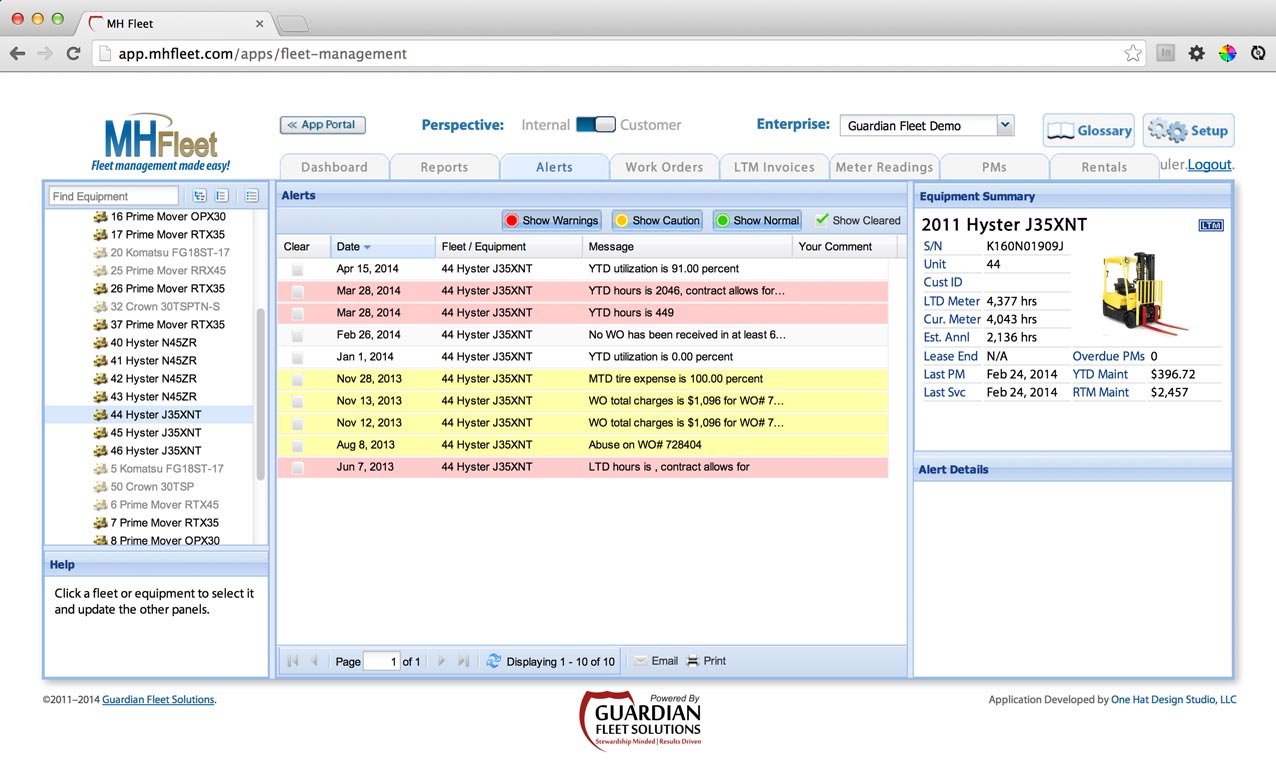
Every evening, the MH Fleet application analyzes all of the equipment in its system looking for conditions which are out of the ordinary. When one of these conditions is met, an alert is created. Users then opt to receive a single daily email detailing all current and unresolved past alerts.
This screen handles management of the alerts. Alerts can be viewed for more detailed information, and cleared.

Alert History
This paged list shows all alerts for the node selected in the Equipment Tree, sorted by date with most recent activity at the top. The alert severity is color-coded for easy recognition. A set of filters determines which severities of alerts (warning, caution, normal, etc) are displayed. Default is for all types to be shown.
Clicking on a row in this table selects a single alert to view in the Alert Detail panel (see right). Clicking on the checkbox (far left) clears the alert. Cleared alerts are not shown in this panel unless the “Show Cleared” button (upper right corner) is pressed. This button toggles between show/hide modes.
Equipment Summary
This panel shows quick information about the equipment related to the selected alert. This panel is identical to the one found on the dashboard.
Alert Detail
This panel shows information about the selected alert in greater detail.